
2.5 Million 1-Table Tournaments - 500,000 players – But Where Do The Profits End Up?
Check Out The Results Of The Worlds Biggest Sit N Go Survey!
Sit And Go Planet, in association with the StarTracker is proud to present the worlds biggest overview survey of SNG results! Covering a total of 2,523,982 individual single table tournaments played at one of the largest poker sites between December 2006 and July 2007 by an incredible 539,444 individual players!
With such a comprehensive sample we have been able to answer some of the questions that Sit N Go players have always asked.
- How Many Players Are Winners?
- What Is The Biggest Win and Loss?
- How Does Winning Relate To The Number of Games Played?
- What Is The Average Number Of Games Played?
- And Many More…
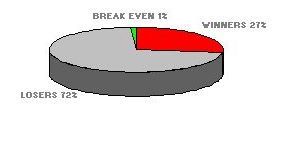
The survey is broken down into buy-in levels. This shows how the numbers change between the $5 SNG Players and those spending $2000 on entry fees. Firstly the all-important overview:
Overall Winners and Losers Ratio  Overall Winners and Losers Ratio
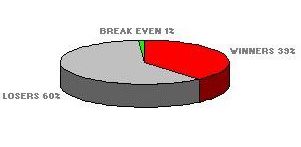
After 100+ Games
![]()
Prize Pool Distribution
Percentage of Total Won By The Top 5% Winning Players
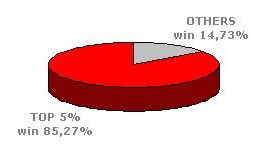
This clearly shows that the top 5% of players take home an incredible 85,27% of the sit n go profits… These can be considered the experts – those people who have dedicated the time and effort to learning as much about SNG Strategy as possible. For 100’s of SNG Strategy Tips and Articles check out our Sit N Go Strategy Section.
We are now in a better position to see the breakdown in profits – these are factored to show what we could expect from 12 months play from each group of players:
1. Top 5% (27000 Individuals)- Mean Yearly SNG Profits = $1150
2. Next 22% (118600 Individuals) - Mean Yearly SNG Profits = $4
Of course there are wide variations within both of these groups depending on what level and how many Sit N Go tournaments are played. Below are the extremes in terms of wins and losses over the sample period to better demonstrate this:
 Largest Individual Winner = $234719
Largest Individual Loser = $-36686
Most SNGs Played By An Individual = 18242
Median Number Of Games Played By All Individuals = 8
The low median score gives us a clearer insight into where the money comes from in SNGs. A large number of people inexperienced in this form of poker give it a try for 8 or so games and then move elsewhere. Without some knowledge of how strategy changes at the different stages of Sit N Go Tournaments many people are destined to lose.
Median Return On Investment Figures By Level For Players With 1000+ Games
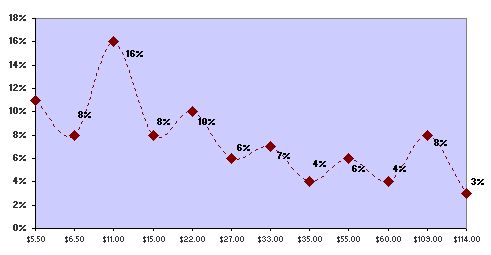
In the chart above we see the expected inverse relationship between buy-in and returns. We also note that the levels which include Turbo SNG options show slightly lower scores reflecting the fact that there is less time for the skill differences of individuals to show. Learn more about Return on Investment in our Sit and Go Strategy Bankroll Management Section.
Further Breakdown By Buy-In Levels
|
Buy In
|
Number of Individuals
|
% Winners
|
% Winners
> 100 Games |
% Prizes
Top 5% |
Most Won
|
Most Lost
|
Median ROI
|
|
$5.50
|
306,554
|
30%
|
50%
|
58.36%
|
$2,502
|
-$1,810
|
0.11
|
|
$6.50
|
277,090
|
30%
|
49%
|
61.77%
|
$3,754
|
-$3,271
|
0.08
|
|
$11
|
236,388
|
30%
|
55%
|
57.61%
|
$4,029
|
-$2,640
|
0.16
|
|
$16
|
209,520
|
29%
|
51%
|
64.39%
|
$32,345
|
-$3,796
|
0.08
|
|
$22
|
133,909
|
30%
|
58%
|
55.48%
|
$4,962
|
-$2,554
|
0.10
|
|
$27
|
134,283
|
29%
|
49%
|
61.06%
|
$17,097
|
-$4,387
|
0.06
|
|
$33
|
82,658
|
30%
|
61%
|
54.92%
|
$8,319
|
-$4,044
|
0.07
|
|
$35
|
45,537
|
33%
|
73%
|
41.20%
|
$2,778
|
-$2,762
|
0.04
|
|
$55
|
59,940
|
30%
|
59%
|
54.02%
|
$13,380
|
-$6,530
|
0.06
|
|
$60
|
85,594
|
28%
|
43%
|
61.24%
|
$26,810
|
-$8,230
|
0.04
|
|
$109
|
26,792
|
30%
|
61%
|
53.21%
|
$25,986
|
-$5,328
|
0.08
|
|
$114
|
36,927
|
30%
|
47%
|
56.03%
|
$36,143
|
-$24,615
|
0.03
|
|
$215
|
6,507
|
31%
|
70%
|
45.85%
|
$18,075
|
-$6,175
|
n/a
|
|
$225
|
18,175
|
30%
|
50%
|
55.02%
|
$41,320
|
-$14,139
|
n/a
|
|
$302
|
2,431
|
32%
|
83%
|
43.10%
|
$14,040
|
-$12,906
|
n/a
|
|
$317
|
8,192
|
32%
|
70%
|
56.57%
|
$66,384
|
-$14,946
|
n/a
|
|
$320
|
22
|
40%
|
0%
|
26.14%
|
$1,030
|
-$640
|
n/a
|
|
$335
|
3,834
|
32%
|
65%
|
50.48%
|
$33,723
|
-$9,176
|
n/a
|
|
$503
|
754
|
33%
|
0%
|
40.03%
|
$17,335
|
-$7,307
|
n/a
|
|
$528
|
3,974
|
33%
|
64%
|
53.97%
|
$69,892
|
-$28,407
|
n/a
|
|
$555
|
1,787
|
33%
|
75%
|
50.29%
|
$28,993
|
-$15,086
|
n/a
|
|
$1,005
|
450
|
33%
|
0%
|
46.76%
|
$22,785
|
-$17,640
|
n/a
|
|
$1,055
|
1,221
|
34%
|
44%
|
47.95%
|
$69,330
|
-$50,235
|
n/a
|
|
$1,100
|
480
|
34%
|
0%
|
43.71%
|
$23,984
|
-$24,042
|
n/a
|
|
$2,009
|
64
|
31%
|
0%
|
29.61%
|
$16,746
|
-$6,027
|
n/a
|
|
$2,109
|
179
|
35%
|
0%
|
36.20%
|
$41,475
|
-$35,439
|
n/a
|
|
$2,190
|
135
|
40%
|
0%
|
38.78%
|
$32,781
|
-$16,894
|
n/a
|
Note: Statistical analysis of the median roi level above $114 was not possible on this occasion due to the small number of players with >1000 games at these levels.
Ever wondered which site has the fishiest SNGs? The Quickest Clearing Bonus? The Best Sit and Go Tournament Software? Check out our detailed guide to the Best Site For SNGs for more... I strongly recommend Titan Poker for anyone serious about their SNG play - one of the biggest selection of 1-table tournaments anywhere + a great loyalty scheme and 200% to €1500 bonus + $20 for free with Bonus Code SNGPLANET - check out Titan Poker for yourself today!